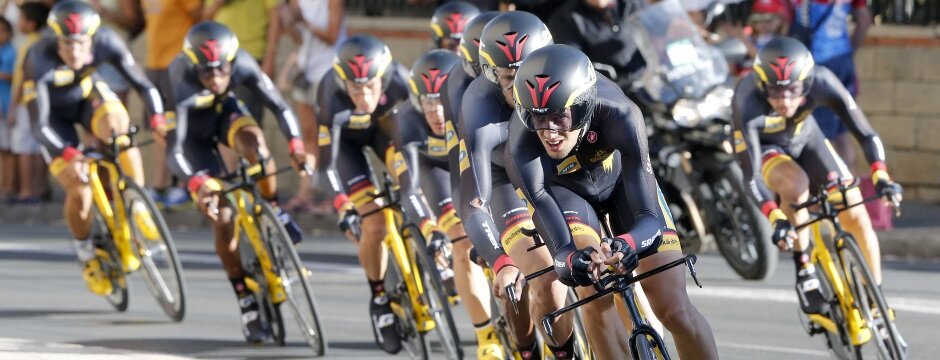
Team MTN-Qhubeka announced the arrival of African cycling by achieving a respectable 12th place finish in the opening stage of the Vuelta Espana 2014. The team powered through the 12.6km flat team time trial (TTT) course in 14:42, finishing just 29 secs off the winning team Movistar.
“For our our grand tour debut we did a really good job.” said Jacques Janse van Rensburg. “We started off at about 95% effort through the first technical cobbled section. As soon as we got onto the smooth tar it was “full gas” for every rider. We raced through the first half well, setting a solid time for the intermediate check. In the final 2km uphill drag we were on the limit, but we timed our effort really well finishing with six riders. Our director sportifs, Manel Lacambra and Jens Zemke did a great job in determining the team order and guiding us through the course. We didn’t take risks in the corners as we were concerned about the slippery surface which had resulted in crashes of other teams during practice sessions. I was sitting behind our two sprinters, Kristian and Gerald who were tasked with accelerating the team up to speed. I am really happy with the performance of the team and I am confident that we will perform well in the next 3 weeks.”
Jacques SRM data file gives us a more complete picture of the physiological demands of this effort.
Summary Data:
Average Power = 369W
Normalized Power = 385W
Average Cadence = 86.2rpm
Ave Speed = 51.2kph
Fig 1: Jacques Vueta Espana Stage 1 Jerez TTT – Line graph

This graph shows the high variation in speed, power and cadence, typical of a short technical TTT. At the start Jacques was positioned at the back of the train (7th/9 position). In this position athletes experience the impact of the “slinky effect” as the train decelerated and accelerates through technical sections. Within the first half of the race he put in five hard 10-15 second accelatory efforts (650-1000W) as he fought to fight to stay with the train out of the corners. The file also shows the 20-50 second 450-530W efforts he contributed to the team as they drove on towards to the finish line
Insert Fig 2: Jacques Vueta Espana Stage 1 Jerez TTT – Distribution graph
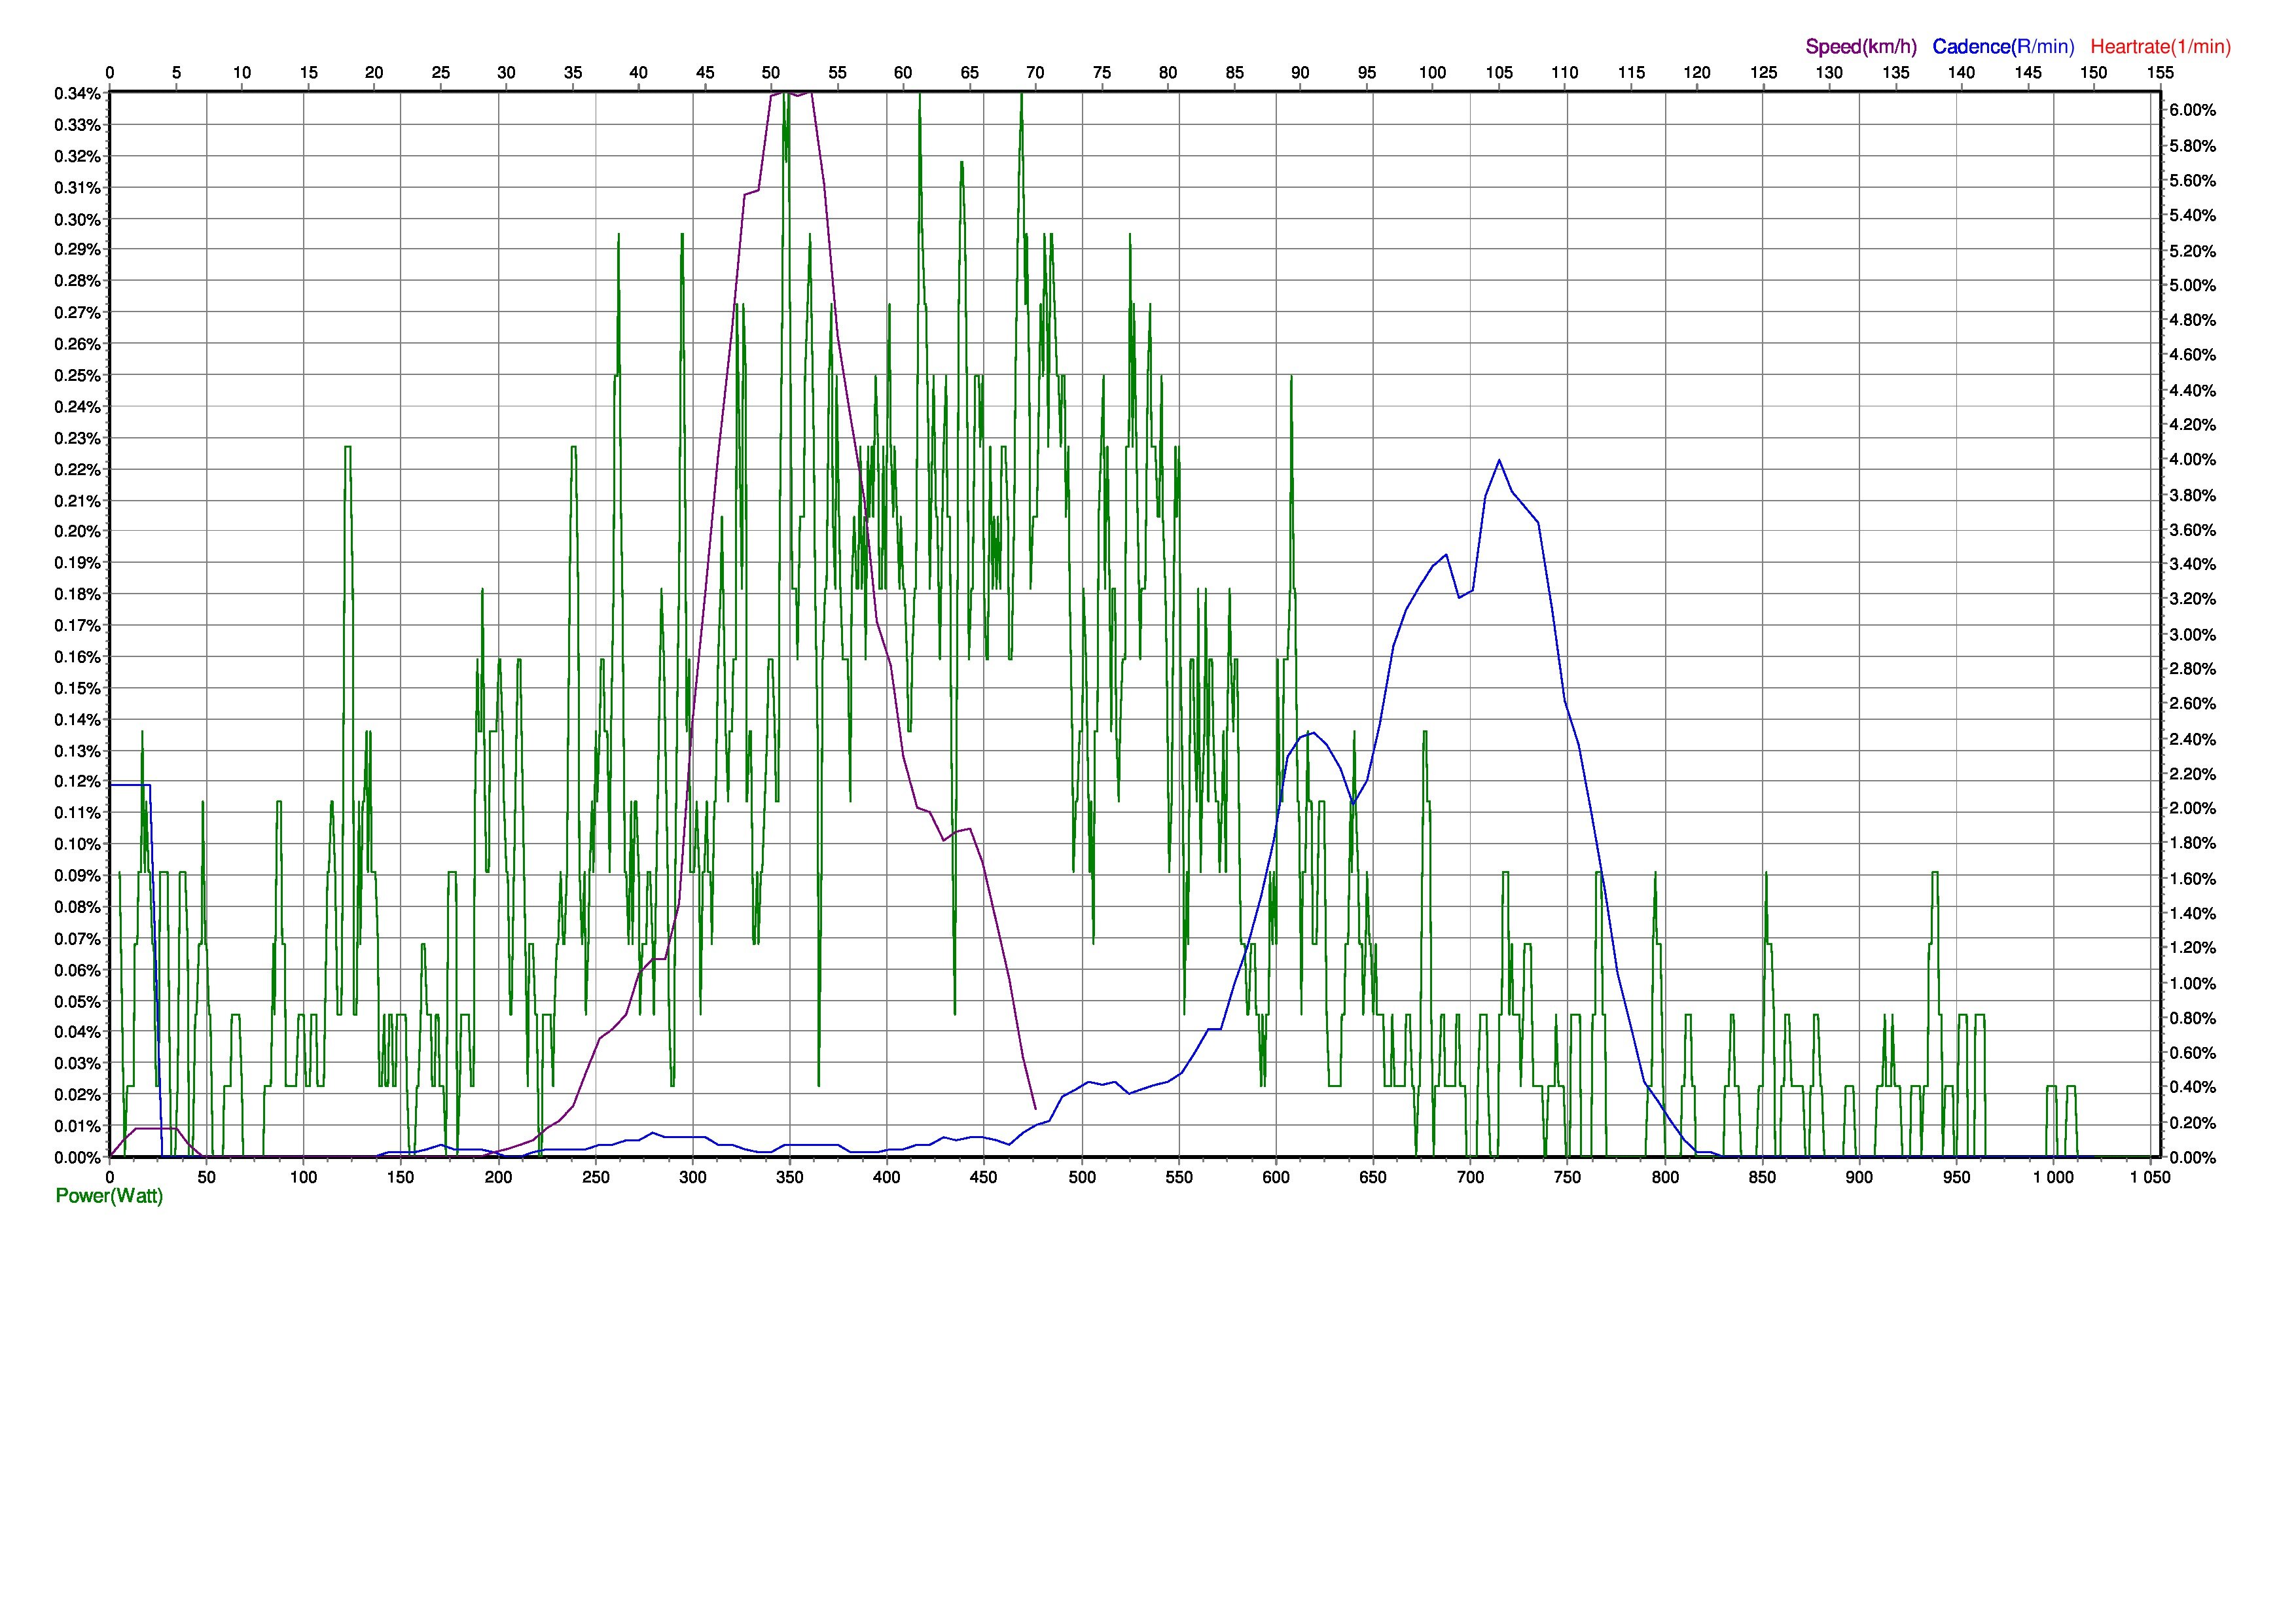
For more than half the race Jacques was in “the red zone” producing powers above his estimated functional threshold. This distribution graph shows the wide range of powers applied, most commonly in the 360-560W zone. While his average cadence was only 86.2rpm, his median cadence was 104rpm i.e. when he wasn’t coasting through corners and traffic circles he was pedalling at high speed/power.
“This data highlights the importance of accelatory and anaerobic power conditioning for performance in the team time trial” says Trevor Court, Coach to Team MTN-Qhubeka. “I’m delighted with the team and Jacques performance. Jacques has put in lots of hard and smart work this season, and it’s great to see it paying dividends.